I mentioned in a prior post about merging various digital data collection files. Exploring this data has been an interesting experience, particularly prior to heading to the villages where the data is being collected. There are hundreds of ways to look at the data, but the first pass was taking a cursory look at data quality. One common metric that many folks like to report is the how frequently a survey question is answered.
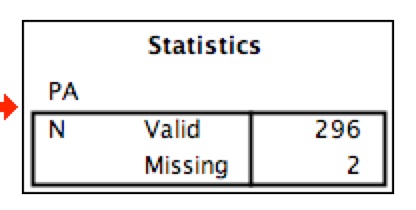 And the missing data here is village name (aka PA) . So we can count all the beans, or have a computer count those beans for us.
 And we can produce all of these tables and graphs like the one above. But the core question in my opinion is what that “2” above really means and why. So in many ways it’s important to walk away from the “data” for a moment and go back to the context. Is the missing village information because…
- the digital data collection form has a glitch?
- Does the question appear unclear to the women who are answering the questions and they are just moving on to the next question?
- Is the data collector chatting with the respondent woman in another village but that village is not on the list and despite reporting on their home village they are unsure of what to check?
- Or is it because they are in a rush and just need to finish the survey and get back to their daily activities so they move quickly to the next question.
Some digital data collection tools can help improve data quality…. to a certain degree. For example, below is a function which requires an answer prior to proceeding to the next survey question. It’s not a full fix (as future posts will discuss) but may help decrease missing data which is just one marker of quality.